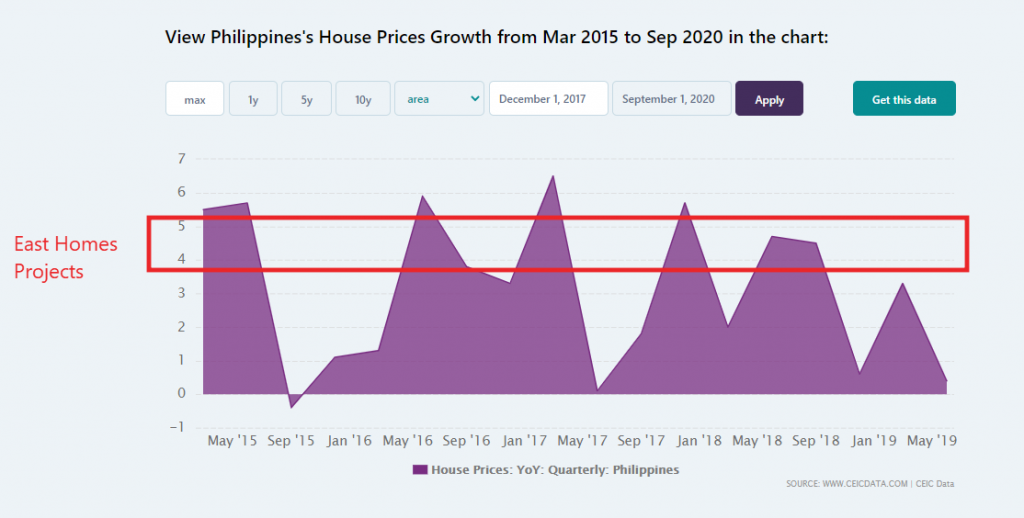
The following chart will help you see the value appreciation of your house in East Homes. This will help you appreciate the decision of growing your money instead of simply saving it in the bank or spending it in perishable assets.
| Price Growth | June 2016 | Mar 2021 | May 2022 | Growth (end to end) |
|---|---|---|---|---|
| Mansilingan | ||||
| Duplex | 550,000* | 640,000* | +14.06% (Jun 2016-Mar 2021) | |
| 2 Bedroom | 1,068,000* | 1,320,000* | 1,340,000 | +19.09% (Jun '16-Mar '21) +25.46% (Jun '16-May '22) |
| 3 Bedroom | 1,369,400* | 1,730,000* | 1,760,000 | +20.84% (Jun 2016-Mar 2021) +28.52% (Jun '16-May '22) |
| Oct 2018 | Mar 2021 | May 2022 | ||
| Lot only 100sqm | 4,448/sqm or 444,800 | 4,700/sqm or 470,000 | 490,000 | +5.36% (Jun 2016-Mar 2021) +10.16% (Jun '16-May '22) |
| Lot only 140sqm | 686,000 | |||
| Fortune Towne East Villas | ||||
| Dec 2016 | Mar 2021 | May '22 | ||
| Duplex | 560,000 | 660,000 | 680,000 | +15.15% in 4y and 3mo +21.43% (Jun '16-May '22) |
| 2 Bedroom | 1,041,500 | 1,350,000 | 1,370,000 | +22.85% in 4y and 3mo +31.54% (Jun '16-May '22) |
| 3 Bedroom | 1,482,000 | 1,770,000 | 1,800,000 | +16.27% in 4y and 3mo +21.46% (Jun '16-May '22) |
| 2 Story | 1,843,000 | 2,210,000 | 2,250,000 | +16.60% in 4y and 3mo +22.08% (Jun '16-May '22) |
| *Price includes processing fee and may be inhouse not HDMF Hover and click over the price to see the actual pricing of the times. |
Insights
- Pricing of Mansilingan and Fortune Towne doesn’t have great difference
- The price growth varies on the house model type but relatively higher in 2 bedroom, 3 bedroom and 2 story.
- The average annual growth rate of the units is around 4 to 5% which is at par with the Philippine national
Tagged Blog